
Physics Motion Graphs
Physics motion graphs include position time graphs (also called displacement time graphs) and velocity time graphs. It is important to look at the Y axis and determine which one you have before analyzing the data. Position time graphs show if a person is moving forward or backwards as the line goes up or down. Velocity time graphs show if the person is going faster or slower when the line moves up or down.
Watch our position time graph lesson here or on our YouTube channel

Position Time Graphs
Position time graphs show how displacement (another term for position) changes in the Y axis relative to time in the X axis. Since slope equals rise over run and since rise is change in displacement and run is the change in time the slope of a PT graph equals the velocity. See more about calculating velocity in a prior lesson here.
Be aware that position and displacement are used here interchangeably as X variables. Position means where you are located and displacement means how far you are from a prior position with a direction from start to finish.
- Total displacement equals final position minus initial position (x = xf – xi)
- x : displacement
- xi : initial position
- xf : final position
What the Slope of a PT Graph Represents
- A flat line in a PT graph shows no slope, meaning no motion, and therefore at rest (v = 0).
- A positive slope in a PT graph is constant positive velocity (+v).
- A negative slope in a PT graph is constant backward motion (-v).
- A curved line represents an acceleration or deceleration (See the examples below)
PT Graph at Rest
A flat line (no slope) on a position time graph. Think of a number line on the ground as seen in the video.
The person starts at the 12m position and stays there the whole time.
PT Graph Constant Forward Velocity
A straight line means constant "something". In the previous example the stickman was constantly at 12 meters position, so at rest. In this example the line is straight with a positive slope.
Here this stickman starts at the 0 m position and travels to 24 meters (x = xf – xi = 24 - 0) at a constant rate in 6 seconds. Since v = x/t, the velocity here is +24m/6s or 6 m/s forward which is also equal to the slope of the line.
Observe videos, tables, and graphs of various constant motion cars on this page
PT Graph Constant Backward Velocity
In this example the line is straight so we have constant velocity but the slope is negative which represents backwards motion. The stickman in the example starts at the 16 meter position and travels to the 2 meter position.
- x = xf – xi = 2 - 16 = -14
So -14 meters in 6 seconds.
- v=d/t
- v= -14m/6s = -2 1/3 m/s
This stickman travels at a velocity of 2 1/3 m/s backwards since it was negative (also the slope of the line).
PT Graph Acceleration Moving Forward
This stickman in this example starts at rest vi = 0 m/s and accelerates from the 0 position to the 24 meter position with a line going up (forward motion) and a slope constantly curving more upward (accelerating here).
PT Graph Deceleration Moving Forward
The stickman in this example is always going forward as seen by the line always going up until the end. The slope here is getting less and less as the stickman slows down until the end where it is flat and he is stopped.
Solving Problems with Position Time Graphs
The two things you can read off a position time graph are positions (or the displacement) and time. Anything else you will have to solve for. You can find velocity using a position time graph by taking the initial and final positions and the time it took to do this. Use the equations below to do this.
- v = Δx/t
- v = (xf – xi)/t
To determine the velocity any where before 5 seconds in the PT graph to the right you can use the initial and final position for that interval.
xf = 8 m/s , xi = 0 m/s , t = 5s
v = 8/5 or + 1.6
The velocity anywhere in the 0-5 second interval is 1.6 m/s forward

Distance Verses Displacement on a Position Time Graph
Remember that going up on a PT graph means going forward and down means backward.
Lets analyze this motion above. This object went:
- A constant velocity forward 8 meters in 5 seconds
- Was at rest between 5 and 15 seconds
- Went constant velocity backwards 4 meters between 15 and 30 seconds.
To determine the vector displacement subtract where the individual ended from where they began.
To determine the scalar distance using this graph add any time you are going forward or backwards.
- The displacement from 0-30 seconds is (+8) + (-4) = +4, or 4 meters forward.
- The distance from 0-30 seconds is 8 + 4 = 12, or 12 meters.
Velocity Time Graphs
Velocity time graphs show how velocity changes in the Y axis relative to time in the X axis. Slope equals rise over run and since rise is change in velocity and run is the change in time the slope of a VT graph equals the acceleration.
What a velocity time does not show is the actual position of the object, just how the position is changing. You can determine the change in displacement using information from the graphs and our acceleration or 1D motion equations as seen on our equation sheet.
What the Slope of a VT Graph Represents
- A positive slope in a VT graph is acceleration (+a).
- A negative slope in a VT graph is deceleration (-a).
- A flat line in a VT graph shows no slope, meaning no acceleration, and therefore constant motion (a = 0).
Watch the lesson on velocity time graphs directly on our YouTube channel here
VT Graph Rest
The only place on a velocity time graph that you see rest is at 0 m/s. This is the only point on a velocity time graph the stickman is traveling 0 meters every second
VT Graph Constant Positive Velocity
A velocity time graphs slope shows how many meters per second an individual is moving per second. A flat line on a VT graph shows an individual moving a constant m/s. If the line is above the 0 m/s point the person is moving forward.
VT Graph Constant Negative Velocity
A velocity time graphs slope shows how many meters per second an individual is moving per second. A flat line on a VT graph shows an individual moving a constant m/s. If the line is below the 0 m/s point the person is moving backwards.
VT Graph Acceleration In Forward Motion
A velocity time graphs slope shows how many meters per second an individual is moving per second. A curved line on a VT graph shows an individual moving a increasing or decreasing their velocity (meters traveled per second). If the line is above the 0 m/s point the person is moving forward. The curve up above the 0 m/s velocity is accelerating or increasing velocity since the velocity is positive and the change in velocity or acceleration is also positive.
VT Graph Deceleration In Forward Motion
A velocity time graphs slope shows how many meters per second an individual is moving per second. A curved line on a VT graph shows an individual moving a increasing or decreasing their velocity (meters traveled per second). If the line is above the 0 m/s point the person is moving forward. The curve down above the 0 m/s velocity is decelerating or decreasing velocity since the velocity is positive and the change in velocity or acceleration is negative.
Solving Problems with Velocity Time Graphs
The two things you can read off a velocity time graph are velocities and time. Anything else you will have to solve for. You can find acceleration in any straight lined interval by taking the initial and final velocity and the time. For displacement use the equation below or just calculate the area under the slope.
- a = Δv/t
- a = (vf – vi)/t
- x = ((vi + vf)/2)t
Notice that the shape of the graph to the right is the same as the one used in the PT graph before but means something different on a VT graph. Lets analyze the motion.
- The object started from rest and had a constant acceleration until 8 m/s for the first 5 seconds
- From 5 seconds to 15 seconds we had a constant velocity of 8 m/s
- The object decelerated from 8 m/s to 4 meters per second between 15 and 30 seconds
- The object never had a negative velocity (never below 0 m/s) so was always traveling forward

The acceleration during the first interval (0-5s) above was:
- a = (vf – vi)/t
- a = (8 - 0)/5 = 1.6 m/s2
The displacement during the first interval (0-5s) was:
- x = ((vi + vf)/2)t
- x = ((0 + 8)/2)(5) = 20 meters forward
Example PT and VT Graph Problems
1. Which displacement time graph on the right shows the same motion as the velocity time graph below?
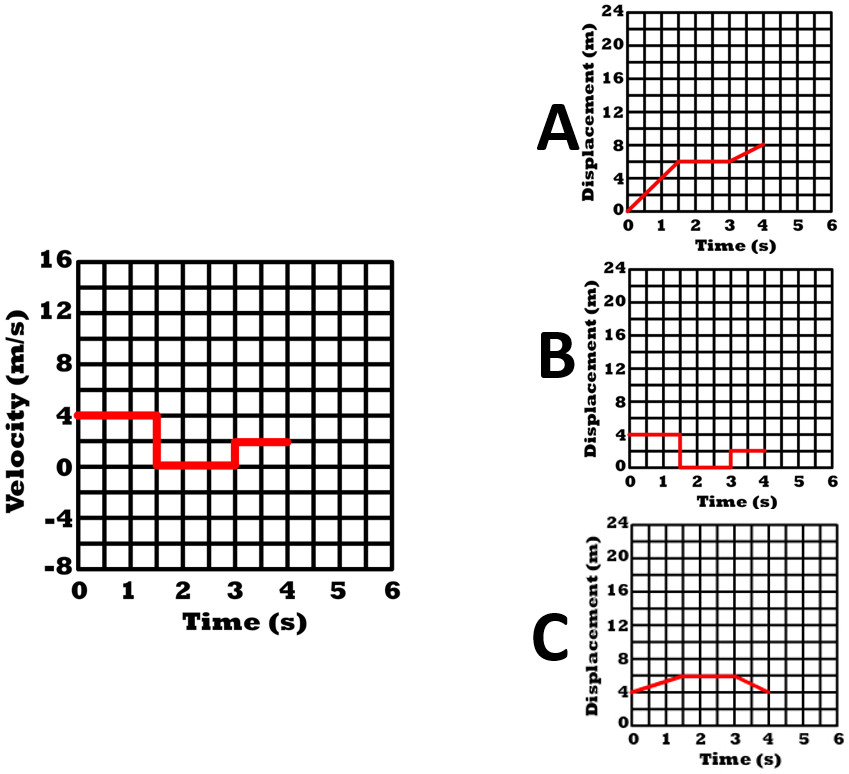
Use the displacement time graph to the right for questions 2-6
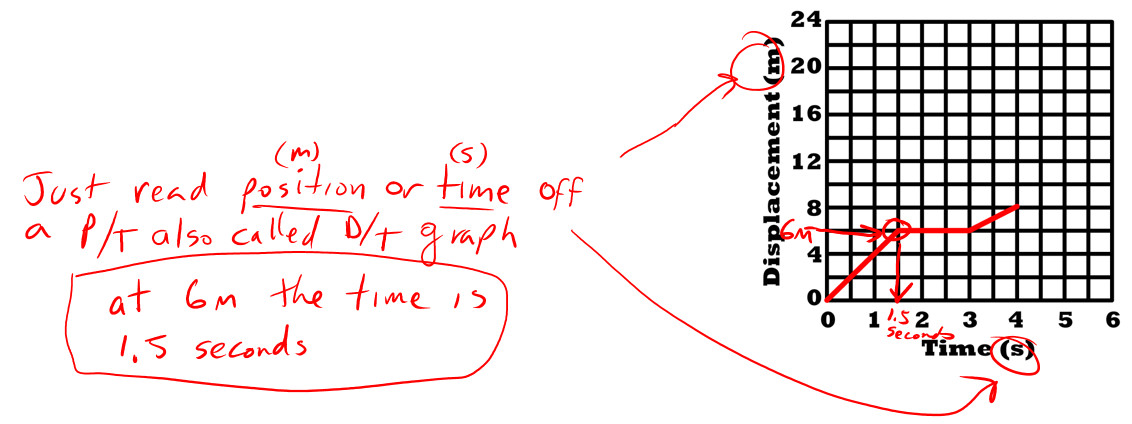
2. How long did it take the object to the 6 m position?
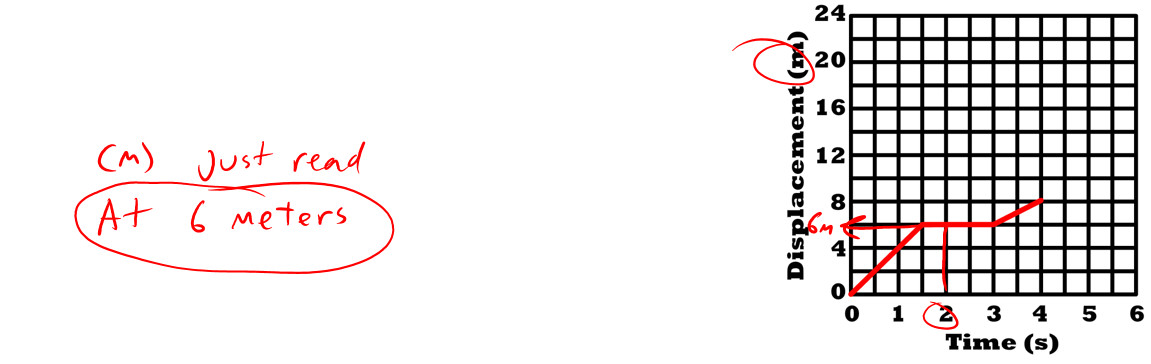
3. What is the objects displacement at 2 seconds?
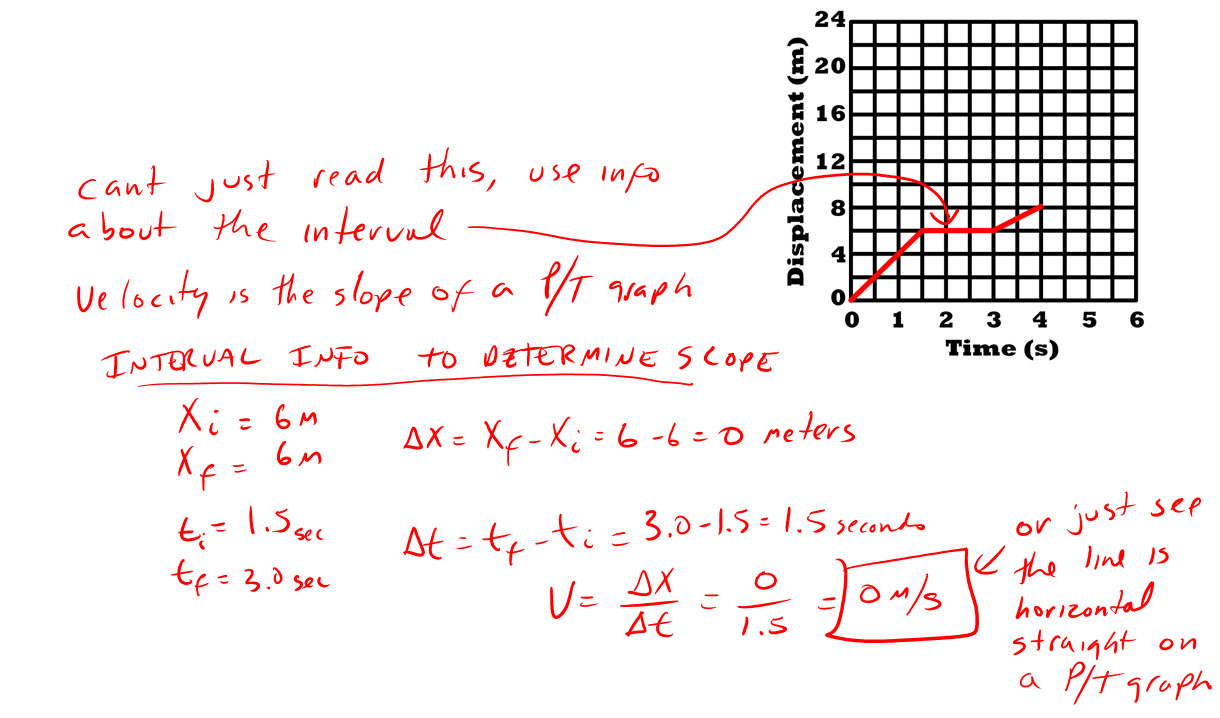
4. What is the objects velocity at 2 seconds?
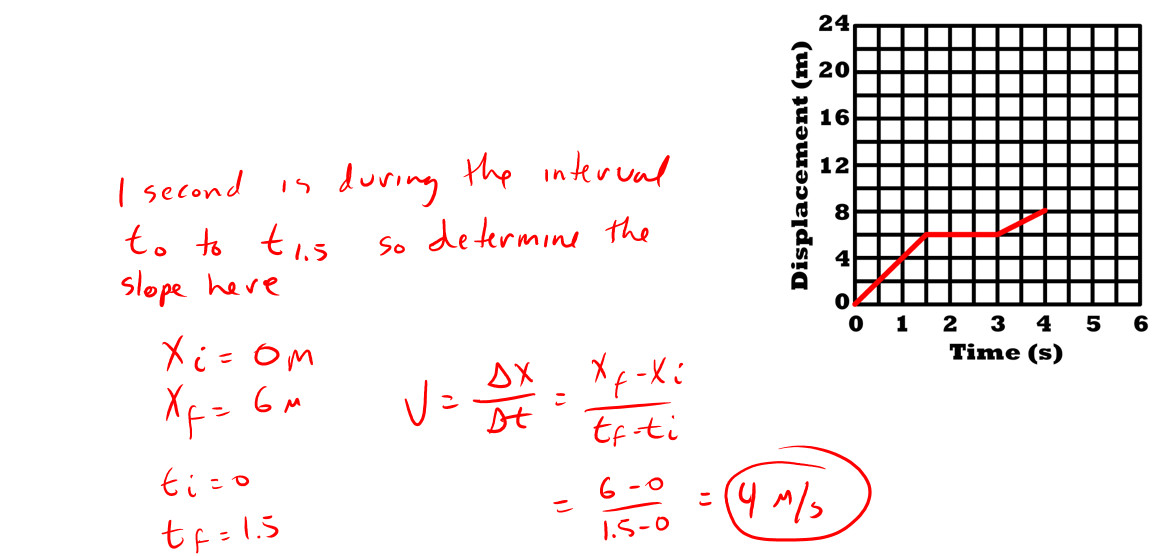
5. What is the objects velocity at 1 second?
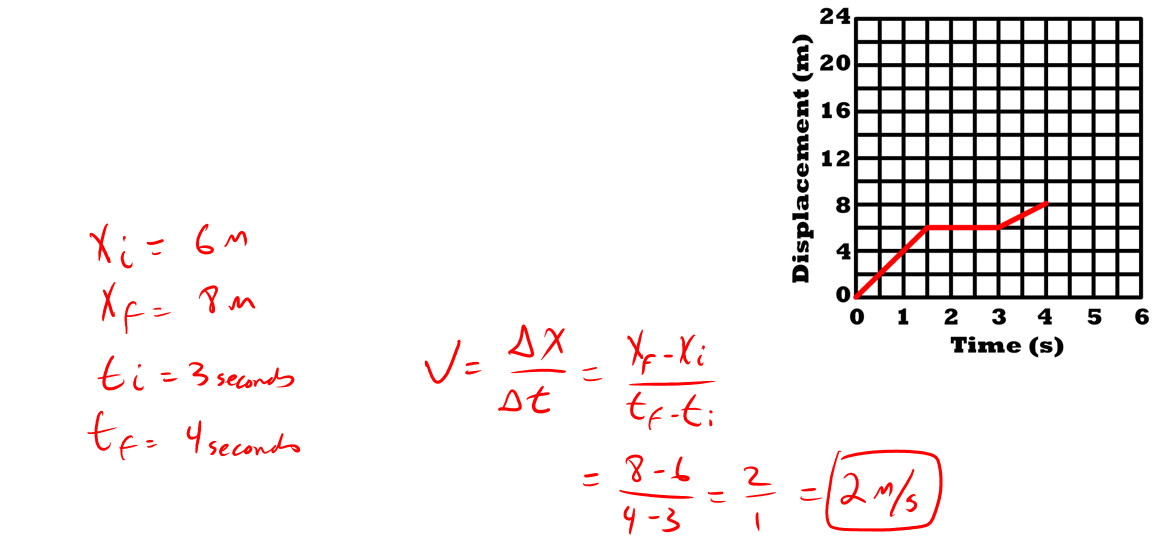
6. What is the objects velocity during the 3-4 second interval?

Use the VT graph to the right to answer questions 7-10
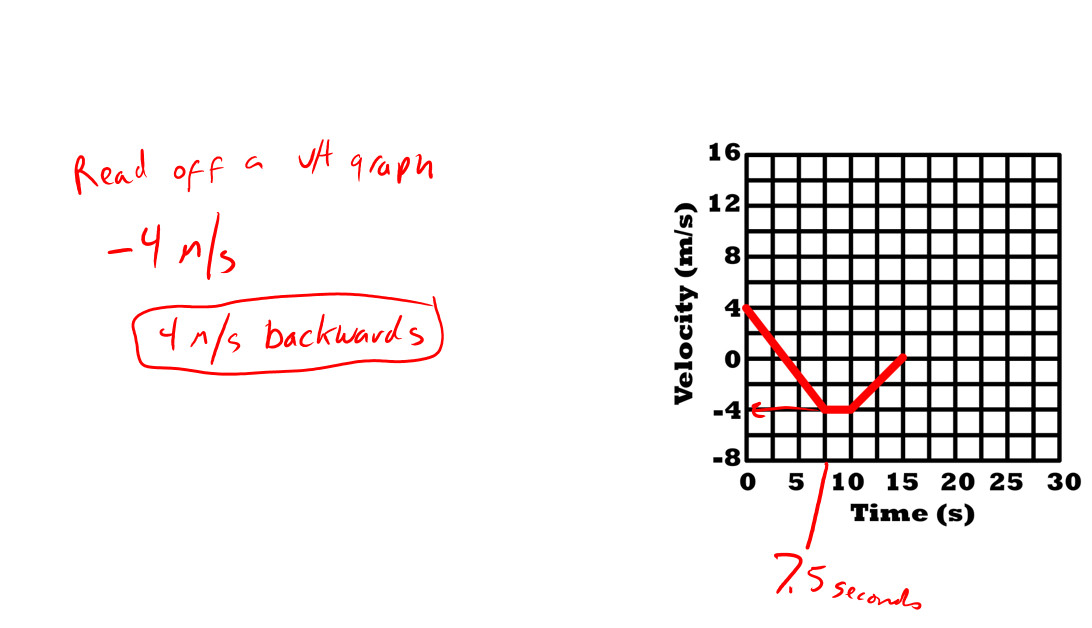
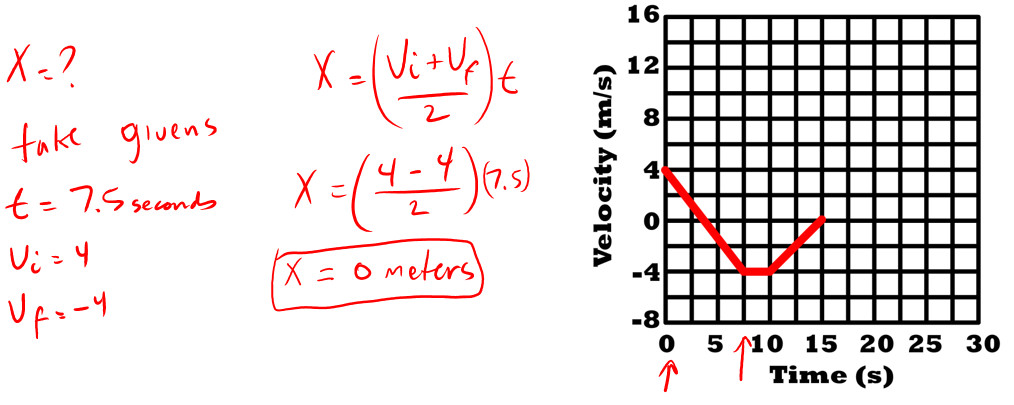
7. What is the velocity of the object in the graphs at 7.5 seconds?
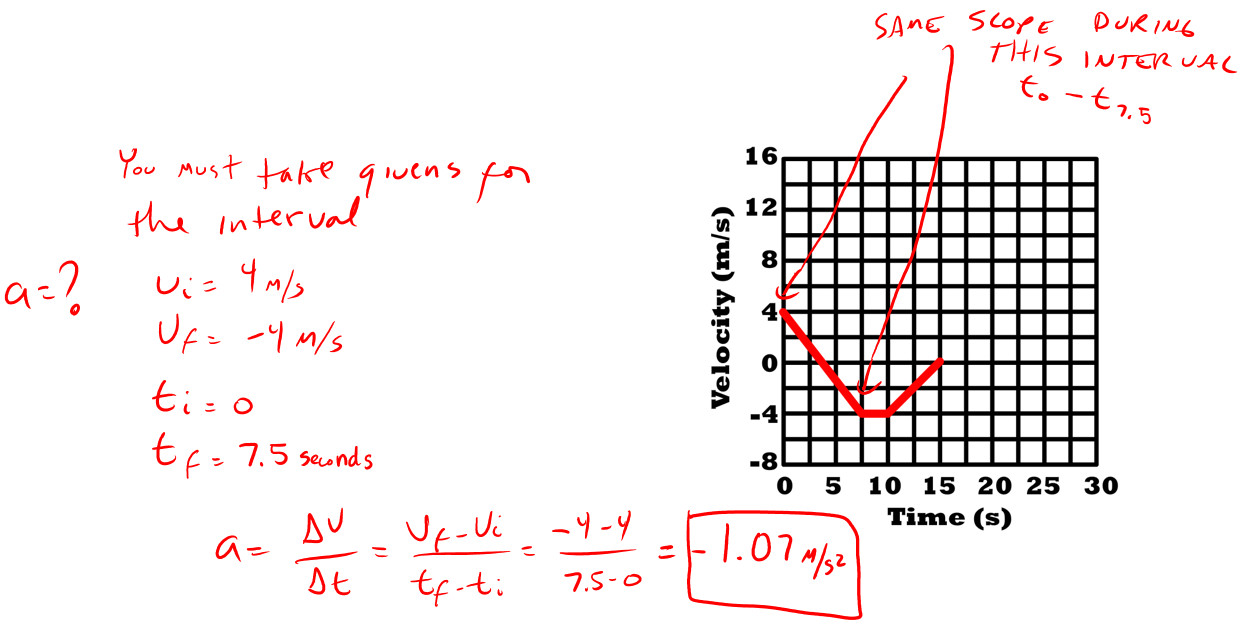
8. What is the acceleration of the object in the graphs at 5 seconds?
9. What is the displacement of the object in the graph from 0 to 7.5 seconds?
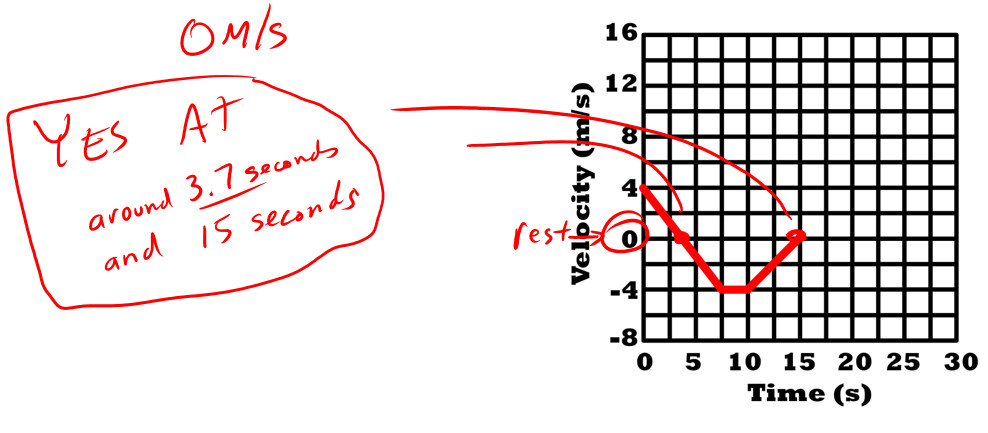
10. Is the object in the graph ever at rest and when?

Links
- On to Acceleration Due to Gravity
- Back to the Unit Main Menu
- Back to the Stickman Physics Home Page
- Find many of your animation resources in one place at the StickMan Physics Gallery