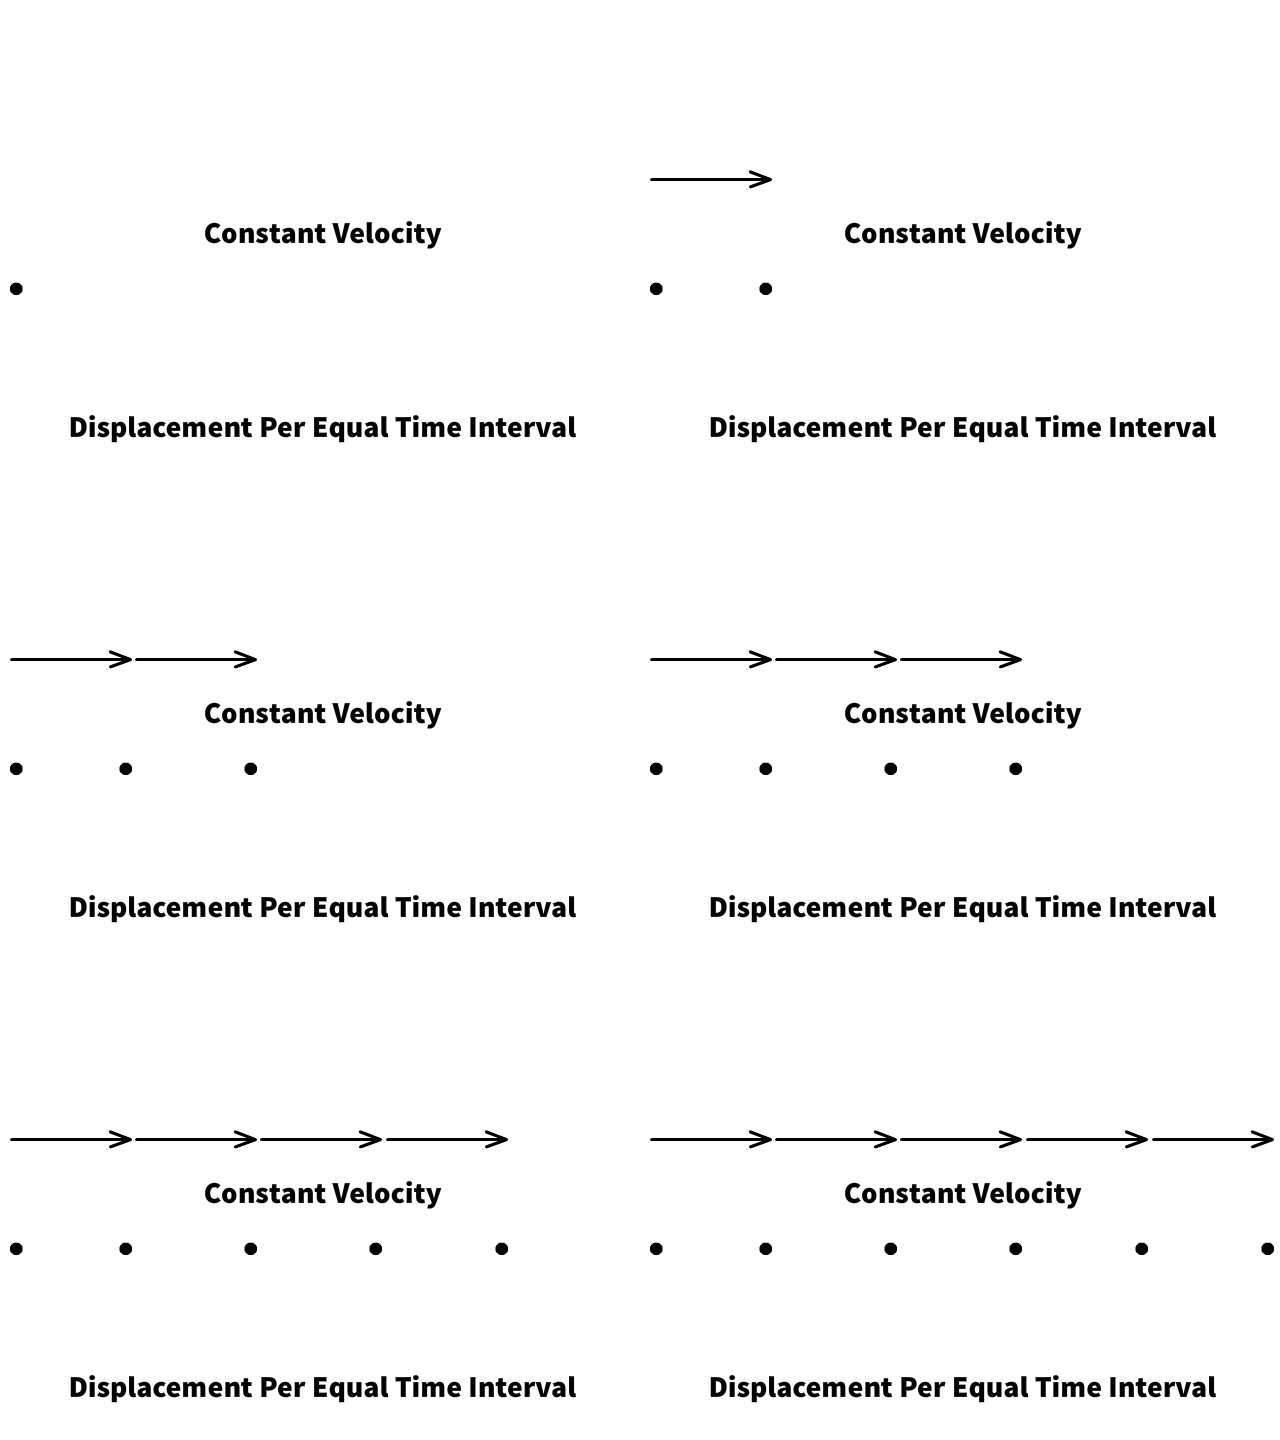
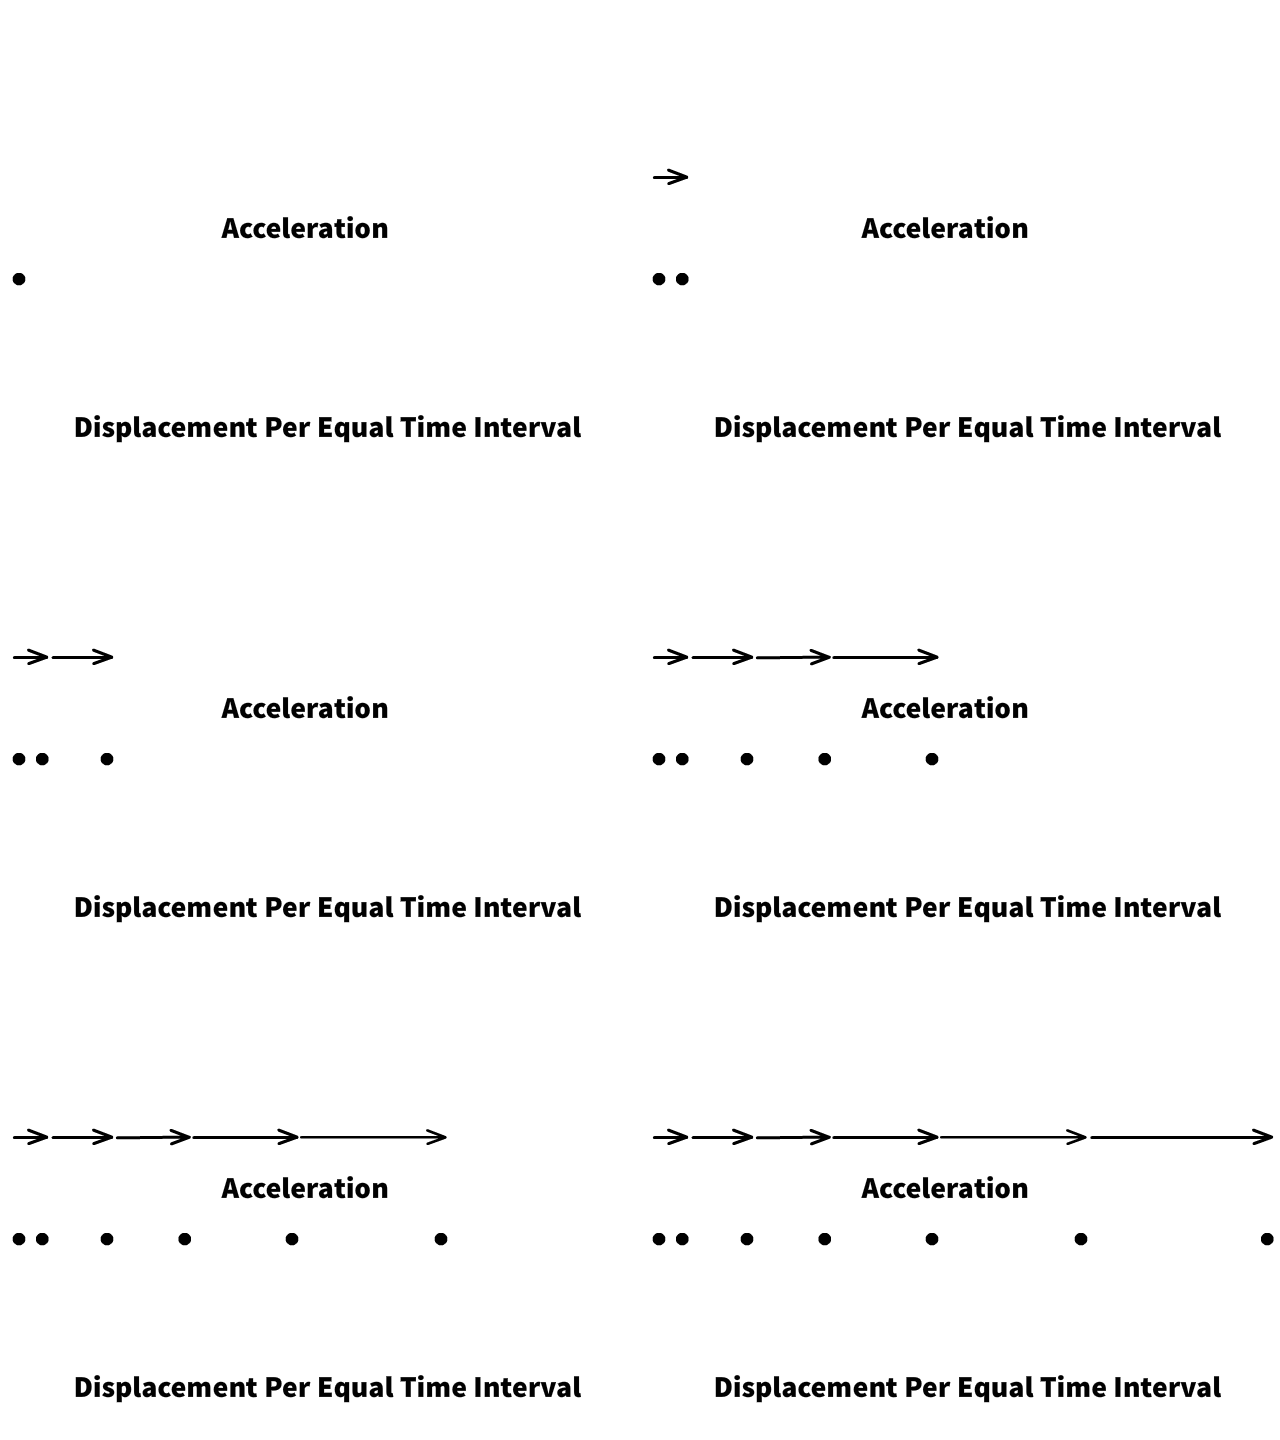
Motion diagrams are a series of visual representations (dots, arrows, or both) that depict an object’s position at regular intervals of time. Motion diagrams provide a snapshot of how an object moves, allowing us to analyze its speed, direction, and changes in motion.
Types of Motion Represented in Motion Diagrams

Constant Velocity:
Dots or arrows are spaced equally apart, indicating the object moves the same distance in each time interval.
Example: A car moving at 60 mph on a straight highway.
Tip: To determine direction, use numbered dots or arrows pointing in the direction of motion.

Acceleration:
Dots or arrows are spaced progressively farther apart (speeding up) or closer together (slowing down).
Example: A cyclist pedaling faster down a hill or braking at a stoplight.
Learn More: Explore acceleration and kinematic equations here.

Deceleration:
Dots or arrows are spaced progressively closer together, indicating a reduction in speed over time.
Example: A car approaching a red light or a ball rolling uphill, gradually slowing to a stop.
Dynamic Equilibrium:
- Arrows are equal in length and point in the same direction, indicating balanced forces acting on an object already in motion at constant velocity.
- Example: A puck gliding on an air hockey table.
Static Equilibrium:
- Dots overlap, showing no movement. This occurs when all forces are balanced, and the object remains stationary.
How to Create and Interpret Motion Diagrams
Motion diagrams are an essential tool for visualizing how objects move over time. Here’s how to create and analyze them:
Standard Motion Diagram Steps
#1 Define the Time Intervals:
- Divide the motion into equal time intervals, such as every second. Intervals can be labeled (e.g., 1s, 2s, 3s) for clarity.
#2 Plot Positions:
- Mark the object’s position at each interval.
#3 Analyze Patterns:
- Equal spacing between points represents constant velocity.
- Unequal spacing reveals acceleration (dots farther apart) or deceleration (dots closer together).
Motion Diagrams with Multiple Stages of Motion
When an object experiences multiple stages of motion, such as speeding up, moving at a constant velocity, stopping, or changing direction, you can number the positions:
- Numbering Positions:
- Place numbers, representing equal time intervals, beside dots to indicate the sequence of motion.
- Overlapping dots with the same number indicate the object is at rest during that time interval.
- Changing Direction:
- A direction change is represented by dots reversing direction on the diagram. The spacing will still indicate the speed (e.g., closer dots mean slower speeds).
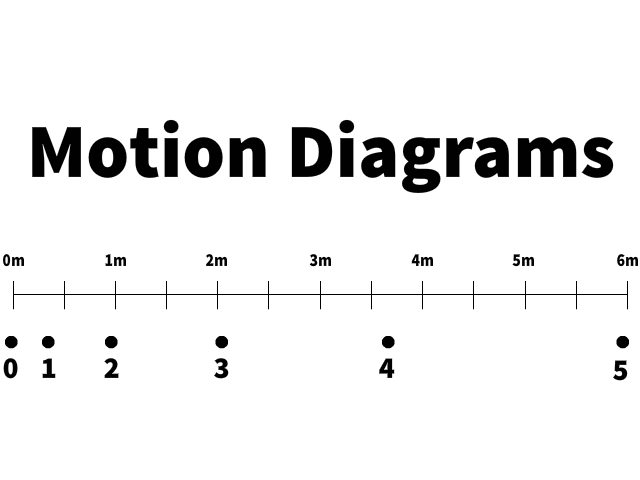
This motion diagram features a metric scale and clearly labeled time intervals with numbered dots. The object’s motion unfolds in multiple stages:

- Slowing Down to the Right: Over the first 6 seconds, the object moves to the right, with dots progressively closer together, indicating deceleration. At the 6-second mark, the object is 3 meters from the origin.
- At Rest: From 6 to 8 seconds, the object remains stationary, represented by overlapping dots labeled 6 and 7.
- Speeding Up to the Left: Starting at 8 seconds, the object reverses direction and accelerates to the left. Dots grow progressively farther apart, ending at approximately 1.6 meters from the origin by the 12-second mark.
This diagram visually captures the object’s changing motion, including deceleration, rest, and acceleration in the opposite direction.
Why Are Motion Diagrams Important?
Motion diagrams simplify complex motion by breaking it into manageable parts, making them a cornerstone of physics education and research. They:
- Help identify acceleration, deceleration, or equilibrium in motion.
- Provide a visual connection between theoretical equations and real-world phenomena.
- Clarify changes in motion, such as rest, constant velocity, or directional shifts.
Example:
- A ball rolling uphill slows down (dots closer together), comes to a stop (overlapping dots), then rolls back downhill (dots progressively farther apart in the opposite direction).
By numbering and analyzing patterns, motion diagrams offer a versatile method to understand even the most complex movements. Explore how acceleration and deceleration are mathematically connected to motion diagrams in our detailed kinematics and acceleration guide.
Practical Applications of Motion Analysis
- Sports Physics:
- Analyze a sprinter’s acceleration off the blocks or a baseball’s trajectory.
- Animation and Gaming:
- Motion diagrams influence how characters and objects move realistically in video games.
- Astronomy:
- Track celestial bodies’ movements across the night sky.
Connect Motion Diagrams with Physics Concepts
Motion diagrams are closely related to kinematics and Newton’s Laws of Motion. For example:
- Constant motion (dynamic equilibrium) illustrates Newton’s First Law.
- Unequal spacing in diagrams ties directly to acceleration and kinematic equations.
Summary
Motion diagrams are more than just dots and arrows; they’re a window into understanding how objects move in the physical world. Whether it’s analyzing acceleration, visualizing equilibrium, or exploring motion in sports and astronomy, motion diagrams offer a versatile way to bring motion to life. For an interactive experience, use tools like the PhET Moving Man Simulation to not only analyze graphs but also create motion diagrams that mimic real motion scenarios.

