Test your understanding of fluid density with our Density of Fluids Practice page! This page features multiple-choice questions, ranking tasks, and graphical analysis to help you explore the relationship between mass, volume, and density using standard physics units—kilograms (kg), cubic meters (m³), and kilograms per cubic meter (kg/m³). Refer to our Density of Fluids page for explanations and problem-solving tips.
Density of Fluids Practice Problem Set Section 1: Multiple-Choice Problems
Question 1:
A liquid has a mass of 4 kg and a volume of 0.004 m³. What is its density?
A) 2,500 kg/m³
B) 500 kg/m³
C) 1,000 kg/m³
D) 10,000 kg/m³
Question 2:
A block of metal has a density of 7,800 kg/m³ and a volume of 0.002 m³. What is its mass?
A) 15.6 kg
B) 7.8 kg
C) 1.56 kg
D) 780 kg
Question 3:
A fluid has a density of 900 kg/m³ and a mass of 2.7 kg. What is its volume?
A) 0.0042 m³
B) 0.030 m³
C) 0.0025 m³
D) 0.003 m³
Question 4:
Which of the following substances is most likely to float in water (density = 1,000 kg/m³)?
A) Substance A: 1,500 kg/m³
B) Substance B: 800 kg/m³
C) Substance C: 1,200 kg/m³
D) Substance D: 2,000 kg/m³
Question 5:
What happens to the density of a liquid when its temperature increases?
A) Density increases.
B) Density decreases.
C) Density remains constant.
D) It depends on the liquid.
Density of Fluids Practice Problem Set Section 2: Ranking Tasks
Question 6:
Rank the following materials by density from lowest to highest:
- Ethanol: 790 kg/m³
- Glycerin: 1,260 kg/m³
- Ice: 920 kg/m³
- Water: 1,000 kg/m³
Question 7:
Arrange these blocks by their sinking speed in water, assuming equal volumes:
- Copper: 8,960 kg/m³
- Lead: 11,340 kg/m³
- Steel: 7,850 kg/m³
- Aluminum: 2,700 kg/m³
Question 8:
Rank these liquids by their likelihood of floating on water:
- Honey: 1,420 kg/m³
- Vegetable oil: 920 kg/m³
- Seawater: 1,025 kg/m³
- Rubbing alcohol: 785 kg/m³
Question 9:
The table below shows the mass and volume for four mystery solutions. Rank the solutions from highest to lowest density.
| Solution | Mass (kg) | Volume (m³) |
|---|---|---|
| Solution A | 4.5 | 0.003 |
| Solution B | 3.6 | 0.004 |
| Solution C | 5.4 | 0.003 |
| Solution D | 4.2 | 0.005 |
Question 10:
The table below shows the mass and volume for another set of mystery solutions. Rank the solutions from highest to lowest density.
| Solution | Mass (kg) | Volume (m³) |
|---|---|---|
| Solution E | 6.0 | 0.004 |
| Solution F | 7.2 | 0.005 |
| Solution G | 8.0 | 0.006 |
| Solution H | 5.4 | 0.003 |
Practice Section 3: Data Analysis
Lab Data for a Mystery Substance
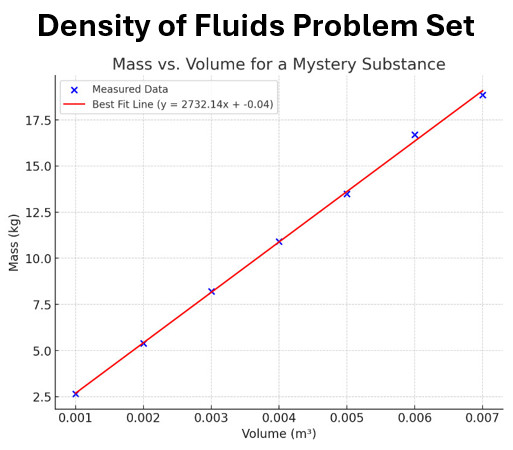
The table and graph below represent data collected by students during a lab experiment to analyze a mystery substance.
| Volume (m³) | Mass (kg) |
|---|---|
| 0.001 | 2.650 |
| 0.002 | 5.400 |
| 0.003 | 8.200 |
| 0.004 | 10.900 |
| 0.005 | 13.500 |
| 0.006 | 16.700 |
| 0.007 | 18.850 |

Best Fit Line Lab Data Question
Question 11: Use the table and graph at the beginning of this section to answer the question
What is the density of the mystery substance based on the best-fit line?
A) 2,700 kg/m³
B) 2,650 kg/m³
C) 2,500 kg/m³
D) 3,000 kg/m³
Other Lab Data Questions
Question 12: Use the table and graph at the beginning of this section to answer the question
Which material is most likely the mystery substance?
A) Aluminum (2,700 kg/m³)
B) Copper (8,960 kg/m³)
C) Steel (7,850 kg/m³)
D) Water (1,000 kg/m³)
Question 13: Use the table and graph at the beginning of this section to answer the question
Why does using a best fit line of multiple data points reduce error?
A) It averages out random variations.
B) It ensures greater reliability.
C) It reduces measurement anomalies.
D) All of the above.
Question 14: Use the table and graph at the beginning of this section to answer the question
Based on the graph, what would be the mass at a volume of 0.008 m³?
A) 20.0 kg
B) 21.6 kg
C) 19.4 kg
D) 18.9 kg
Question 15: Use the table and graph at the beginning of this section to answer the question
If the volume were halved, how would the mass change?
A) Halved
B) Doubled
C) Stays the same
D) Reduced by one-fourth
Conclusion
The Density of Fluids Practice shows how mass, volume, and density are connected. Use this page to revisit problems and data analysis whenever you need to refresh your understanding of fluid density.


